|
|
Connectivity (Beta index)
The simplest measure of the degree of connectivity of a graph is given by the
Beta index (β). It measures the density of connections and is defined as:
where E is the total number of edges and V
is the total number of vertices in the network.
 Beta index, calculated for different graphs
In the figure above, the number of vertices remains constant in A, B, C and D, while the number of connecting edges is progressively increased from four to ten (until the graph is complete). As the number of edges increases, the connectivity between the vertices rises and the Beta index changes progressively from 0.8 to 2. Values for the index start at zero and are open-ended, with values below one indicating trees and disconnected graphs (A), and values of one indicating a network which has only one circuit (B). Thus, the larger the index, the higher the density.
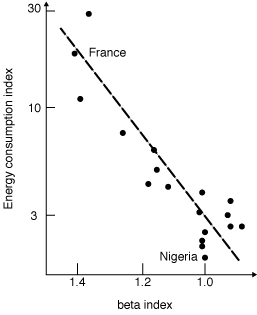
With the help of this index, regional disparities can be described, for example. In the figure below, the railway networks of selected countries are compared to general economic develompent (using the energy consumption-index of the 1960s). Energy consumption is plotted on the y-axis and the Beta index on the x-axis. Where connectivity is high, the economic development is high as well.
 Energy consumption compared to measure of connectivity (Haggett et al. 1977)