Overview of CAC and GIS products
The number of computer programs for spatial data analysis and visualisation have increased during the last decade. Within this learning unit, we will analyse the relationship and the differences between GIS standard packages, GIS desktop software, desktop publishing software (DTP), Computer Aided Design (CAD) and specialised mapping programs.
Overview of some CAC and GIS Software Products.
The following table gives a short overview of the main CAC and GIS Software Products.
Push Control + Right Mouse click to enlarge.
Desktop Publishing Programs (DTP)
Since the late 1980’s, several graphic programs have been developed independently of GIS desktop software. They are suitable for an aesthetical graphic presentation. In contrast to GIS desktop software, desktop publishing programs (DTP) are not designed for spatial analysis as objects have no attached thematic attributes and no database for geographical position information. The most popular DTP programs are
- Adobe Illustrator
- Marcromedia FreeHand
- CorelDraw
DTP programs generally work with stacked data layers, instead of a topological relation between attached element attributes. Therefore, the user has to identify and select identical objects in order to put them on a common separated layer. Thus, we can create different kinds of thematic maps by selecting certain layers.
In Desktop Publishing Programs (DTP), maps are created with layers. On each layer we put identical element groups which, can be switched on or off according to the user's needs.
When we import a map that has been prepared and presented in ArcView into the DTP program FreeHand, we lose the attached data attributes. It is possible to use a software extension (e.g. MAPublisher) in order to retain the attached data attributes. Using the attached database information we can attribute colours to the different land use zones on the map automatically. These different adaptation steps from the ArcView map up to the final cartographic presentation in FreeHand are shown in the following three views.
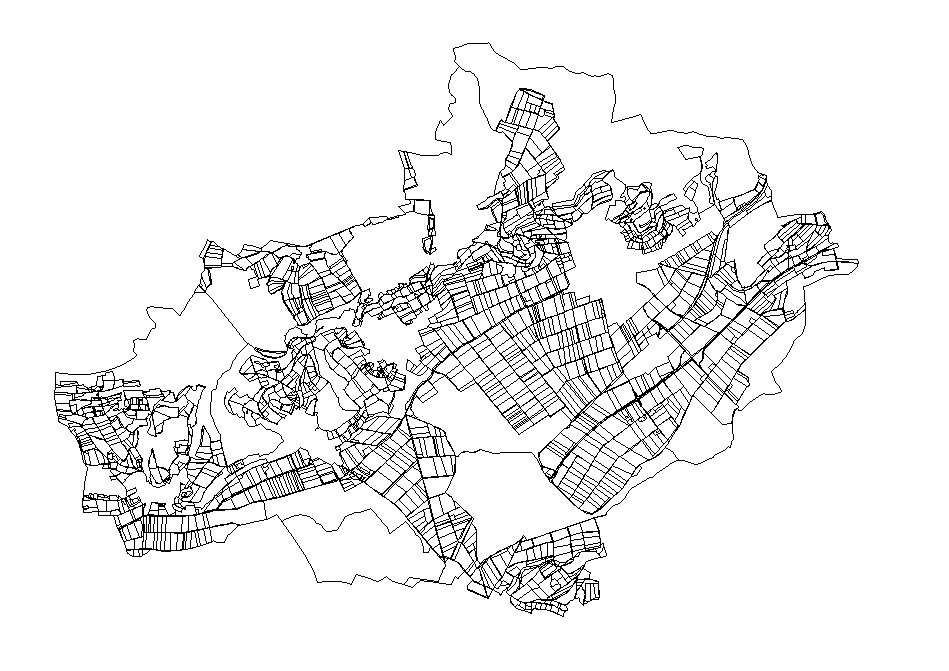 |
ArcView – hidden attributes. |
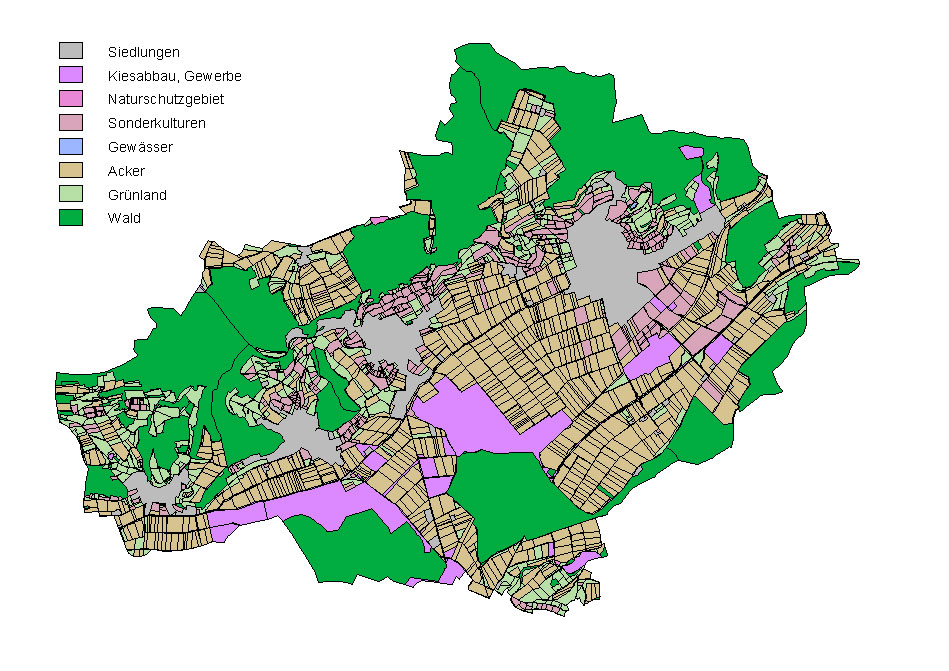 |
FreeHand – initial cartographic representation. |
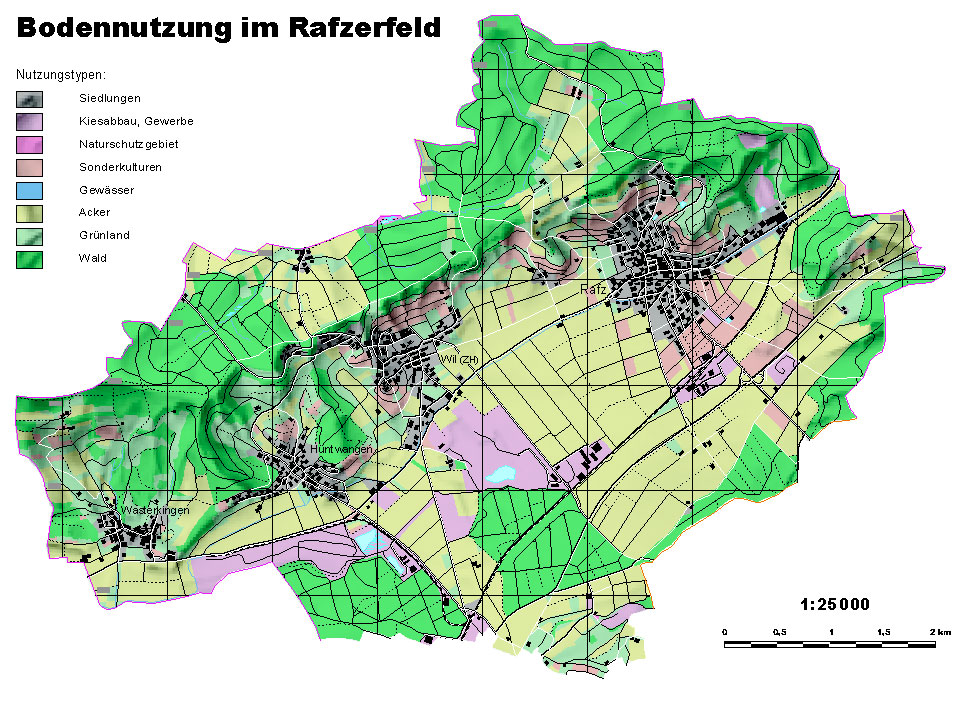 |
FreeHand – with base map and transparent layers.
|
Computer Aided Design Programs (CAD)
Computer Aided Design Programs (CADs) are overall mapping toolboxes that fill the gap between the more simple Desktop Publishing Programs DTP complex Geographic Information Systems GIS. In a strict sense CAD programs process lines by modification of their graphic properties (such as line width and line character). Such line elements can be modified individually on different layers. The program combines standards of data visualisation overall database interfaces with a powerful spatial analysis engine and with object attributes. If spatial information are available, CAD programs are with georeferenced data. Options for data import, data management, data and data visualisation are integrated in CAD. Furthermore, they have combined vector data with layers of raster data or non-spatial attributes. Two well-known CAD programs are:
- Microstation
- AutoCAD
Initially, the CAD programs Microstation and AutoCAD were conceived for mechanical engineering, but the options have been expanded for other sectors and are often used for digital cartography. CAD programs are difficult to learn for beginners, which is a major disadvantage of this software. For this reason, CAD programs are not as user-friendly as other cartographic software (e.g. mapping programs, which are more convenient for cartographic purposes) (Dickman et al. 1999). The following examples show the different ways of visualisation of vector and raster data in Microstation:
") Vector Data (Microstation) Vector Data (Microstation)Vector Data (Microstation) Usual visualisation of vector data in Microstation (symbolised and non-symbolised elements, grouped on different layers) (Dickman et al. 1999). Source: Planning and Information Research Centre GeoPlan |
") Raster Data (Microstation with additional Raster Tool “I/RAS B”) Raster Data (Microstation with additional Raster Tool “I/RAS B”)Raster Data (Microstation with additional Raster Tool “I/RAS B”) Visualisation of symbolised raster data. For this raster option a special raster tool (I / RAS B) had to be downloaded (Dickman et al. 1999). Source: Planning and Information Research Centre GeoPlan |
Mapping Programs
Mapping programs are suitable for users who work with a limited number of base maps. The main focus of mapping programs lies more in the visualisation of modelled spatial data than in the generation of geometric objects (see CAD programs). In contrast to DTP and some CAD programs, mapping systems (such as OCAD and Dry/Nuages) assign symbols, texture, and colours to a chosen object group. Furthermore, it is possible to georeference data. In addition, objects on the map are connected with a database, so that thematic aspects can be analysed. In this manner, thematic information can be attached to geometric objects. The following outline gives a short software overview of some selected mapping programs:
- OCAD
- Dry / Nuage
- RegioGraph
- Map Viewer
- THEMAK_2
- MERCATOR
- EASYMAP
Compared to GIS, mapping programs are easier and more user-friendly. A special layout mode allows aesthetic map adaptations for different map elements, map size, title, legend, colours, scale and map orientation. The ease of use of mapping programs, however, may lead to an unprofessional application of tools. Imprecise and skewed maps may be a result of this. The market for mapping programs has been growing continuously. Generally, the prices and the number of licences sold are not necessarily an indication of the suitability of a mapping program for a user's needs. A simpler and cheaper program may be more suitable than an expensive, GIS-like program. The more individually applicable options a user requires, the better it is to buy an expensive mapping system (Dickman et al. 1999).
Statistical Programs and Spread Sheet Packages
In recent years, statistical programs have started to provide additional visualisation options for spatial data ('map' extension). From a cartographic point of view, however, these tools have a limited potential for creating high quality maps, as they have been primarily designed for statistical purposes. The user has to pre-define the presentation setting and is not able to change them after its application (Dickman et al. 1999). Well-known Statistical Programs are:
- Microsoft Excel
- SPSS/PC+
- SAS/PC>
GIS standard packages and desktop software
Since the 1950s, several factors have changed the way in which spatial data is analysed: Improvements of computer hardware and graphic design, new theories about spatial processes in economic and social geography, increasing social and environmental awareness, education levels and mobility. As a result, in the mid 1960s the first GIS standard packages (e.g. "Canada Geographic Information System" CGIS) were created in order to process the increasing quantities of spatial data. The particularity of GIS is its topological structure, which enables the user to work with logical relations between different geometric elements and attributes. Due to this topological structure, GIS recognises elements having identical attributes (e.g. different objects with the attribute 'forest') although all elements are situated on the same level. Contrary to this, CAC software (such as DTP and CAD programs) are mainly used for data presentation. They often works with stacked data layers instead of topological relations. As there are no attached attributes, identical objects have to be grouped by putting them on a new layer. Today, GIS standard packages have reached new limits due to the infinite range of information that can be set in a geographical context. For this reason, the range of GIS applications has expanded continuously during the last decade. However, at the relatively advanced stage of development, many GIS standard packages are not very user-friendly, difficult to learn, and often rather expensive. Therefore, GIS standard packages have more and more been supplemented by GIS desktop software.
 Comparison of Software Options Comparison of Software Options |
A map that has been created in desktop GIS ArcView 3 without any further extensions. The legend is pre-defined and objects cannot be changed or redrawn individually. |
|
|
|
|