|
|
![]()
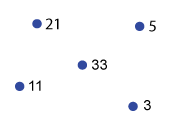
The geometric primitives
In VECTOR MODELS, information
is assigned to points. All the other structures (lines and polygons) are
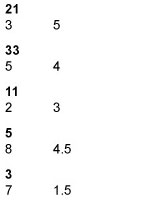
based on points. The geometry of all other structures can be derived based on the coordinates of the
points, such as the length of the connection line between two points, the area of a surface, and the
distance between two objects (Bartelme 2000).
The three geometric primitives are arranged in 2D space, as shown in the following table.
Point
A 2D point is defined by the x‐ and y‐coordinates.
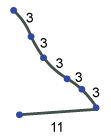
Line
Line segments consist of one or more point pairs. Two points of a segment can be connected by a straight line or an arc. This means that lines can be made up of straight lines, curves, or a mixture of the two.
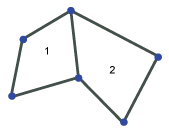
Polygon
Polygons (areas) are composed of connected lines that form a closed geometric shape. The enclosed area is the polygon.
Complex geometries can be modeled as ordered sequences of the geometric primitives.
| DESCRIPTION | GRAPHIC | TABLE |
|---|---|---|
| Point Position, no area. Defined by the coordinates. |
 |
 |
| Line Length, no width. Defined by several segments, which always connect two points. |
 |
 |
| Area Area and perimeter. Defined by several segments, which form a closed polygon. |
 |
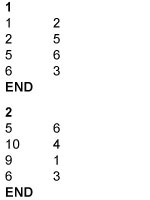 |
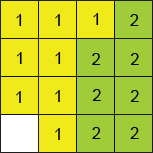
In RASTER MODELS, all values are stored in a simple array (matrix).
In addition, there is a file header,
which contains the following information:
- Number of rows and columns
- Cell size
- Minimum value of x‐ and y‐coordinates
For example:
Ncols 270
Nrows 476
Xcorner 708152.60
Ycorner 121673.90
Cellsize 1
NODATA_Value -9999
| DESCRIPTION | GRAPHIC | TABLE |
|---|---|---|
| Point One cell |
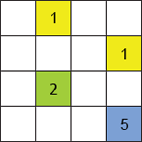 |
 |
| Line Several neighboring cells in which normally one cell is connected at the edges and corners with just one or two neighboring cells. |
 |
|
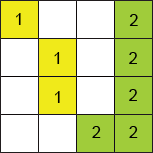
| Area Group of neighboring cells connected at the edges and corners. |
 |
|
|
|
|
|