Line and vector related diagram maps
Definition
Line and vector related diagram maps allow to visualised how
much of something can be transported in which time or speed on what way
and in which direction by means of lines and vectors. Most of the time
not all of these variables are visualised together but rather only
relevant information are represented. The difference of line and vector
related diagram maps lies, among others, mostly in the emphasis of which
information is depicted.
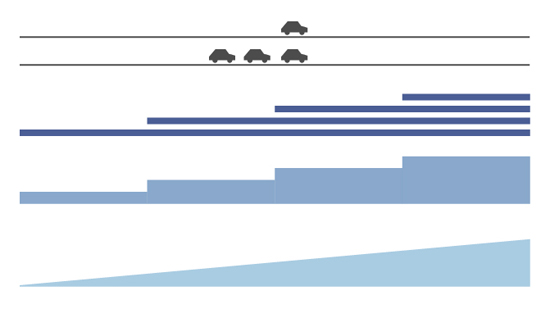
 Example of a flow map using band diagrams (Michael 2002)
For line related diagram maps the emphasis is the quantitative or qualitative information about the transported or moved object. Furthermore starting and ending points of the movements as well as the course are important components. Line related diagram maps are often used in the field of traffic and trade relations.
 Example of a flow map using vectors (Michael 2002)
Vector related diagram maps emphasise on the directions of movements and forces by using arrows to visualised them. For example they are used to show wind directions or historical processes. The arrows can also show quantitative information like number of persons or streams of commuters.
The differentiation of line and vector related diagram maps is not always easy. Often combined variants are seen. This is the reason why these two map types are discussed together in one chapter.
Properties of line and vector related diagram maps
Properties of line and vector related diagram maps
Specific aspects of line and vector related diagram maps are explained below.
Quality
Quality
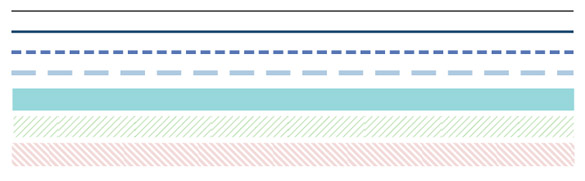
In line and vector related diagram maps movements are distinguished by clear symbols. The symbols can vary in colour, line width, brightness and texture.
Quantity
Quantity
The amount of the moved objects is one of the main points of a line related
diagram. It can be visualised by varying the line width or the number of parallel
unit lines (Imhof 1972, p. 96). The transition of different
amount values can be done in two different ways: the line width changes continuously
or in steps. Stepwise changes comply more with real transport situations and are also
prefered regarding the graphical visualisation.
Continuous changes are used to
generalise high numbers of successive change in the line width. To show the transport
volume even more clear, symbols on the lines can be used in addition.
In vector related diagram maps the quantitative value of the movement is often
secondary in contrast to the direction and the quality of the vectors, like for wind
maps. But if quantitative values are relevant, they can be visualised with different
line widths.
Direction, velocity and duration
Direction, velocity and duration
The direction of a movement is the main point of a vector related diagram map. Usually it is visualised with arrows. Different speeds can be displayed by a number of arrows in a row. If several parallel arrows are displayed, a decreased distance between them relates to a higher speed. If the duration is relevant, it can be noted as text along the vector or with timestamps on the arrows. In line related diagram maps the direction is mostly secondary, but could be also indicated with arrows.
 The duration is indicated by arrows (Spiess 2004)
Legend
Legend
The explanation of the lines and vectors in the legend is inevitable. The unit of value, line widths and the qualitative divisions should be illustrated. The line width can visualise both, a fixed value or an interval. The unit of values is related to the displayed dataset and the message which should be communicated via the map. To save space and to make the map more readable, progressive scale progressive scale are useful. Within a progressive scale the value interval increases progressively, but the change of the line width remains constant. The danger is that the user may incorrectly interpret the map. To read the diagrams correctly, the legend must be consulted.
 Legend of a flow map (Lehmann 1972)
Design of line and vector related diagram maps
Design of line and vector related diagram maps
This section includes important aspects which should be respected when designing a line or vector related diagram map.
Precise representation in plan of the outline of a feature
Precise representation in plan of the outline of a feature
Line and vector related diagram maps, unlike topographic line representations
like railways or roads, do not claim to be precise in the representation in plan of the
outline of a feature. Starting and ending points of movements are often the main content
of line related diagram maps, but the precise course of the line is mostly of secondary
importance. If this is the case, a straight or slightly bended line between the two
points is sufficient. If the lines are directly related to the transport route (roads,
sea route, power line, etc.) they are displayed heavily generalised in the place of the
topographic symbols. Depending on the line width additional shifts in positions are
necessary to provide a readable map.
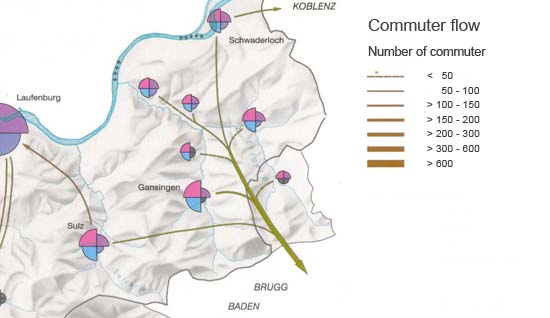
Vector related diagram maps
emphasise on the direction of the arrows which represents only a direction but not a
real linear arrangement. If there is a relation to a linear object in the real world,
but which is not important, only the approximate direction of a movement is depicted.
The precise course can be neglected. This is the case in the following example. The
commuter flows are not shown along a road but show only the rough directions.
Visualisations of trade and traffic statistics
Visualisations of trade and traffic statistics
Within line related diagram maps Imhof (1972) distinguishes between the visualisation of trade and traffic statistics. For visualisations of trade statistics only the start and ending points of a transport are important. The exact route between these points can be neglected. Therefore the start and ending point of movements will be connected when visualising trade statistics. The diagrams show the value of the moved goods. The exact route can not be understood. In contrast the exact routes play an essential role when visualising traffic statistics. Therefore not only a simple starting point to endpoint connection is visualised but also the route in-between. The transported volume is depicted for each section. This type of visualisation is often used to show traffic volumes. The following examples will show the difference between visualisations of trade and traffic statistics. Hover the mouse over the graphics to see the corresponding examples.
Nodes
Nodes
If several lines of a line related diagram map connect to each other in a node (e.g. traffic streams into a city) it often results in graphical conflicts which impair the readability of the map. The closer you get to a city, the higher is the traffic volume which results in a thicker line width what makes it difficult to differentiate the particular lines. The principle to choose the line width cautious and restrained helps to avoid this problem. Another difficulty are junctions of point symbols and lines. A good quality of visualisation can be achieved by using simple point symbols like circles or squares. Furthermore a good readability can be achieved through an appropriate generalisation.
Map examples
Map examples
Below four examples of different types of line and vector related diagram maps are shown.