|
|
![]()
Relief Representation
Relief is so perfectly and precisely represented on topographic maps that if you look on them at a distance of 1 meter you will see crests and valleys, as on a thermoformed map. In the following, you will learn the different techniques used to represent relief on topographic maps.
Remark: However, some practice and imagination are needed by the map reader to visualise hills and valleys from the contour lines of a topographic map.
Contour lines
Contour lines are an effective device for representing relief on topographic maps. They can be defined as an imaginary line
connecting points of equal elevation on the ground surface.
As with all types of isolines, when contour lines are close together, they represent a steep slope, whereas when lines are
far from each other, they represent a gradual slope. Every fifth or tenth contour starting at sea level is an index contour,
which is drawn as a heavier line and is labelled. Each topographic map uses a contour interval, or equidistance, (the distance
in elevation between contour lines) appropriate for that area. While flat areas may be mapped with a 5 meter contour interval,
stepped terrain may have a 20 meter or more contour interval. This is why the contour interval is still specified on the topographic
map legend.
Pull the slider (small black triangle on the left) along the red line to see a cross profile corresponding to the relief along the red line. The red points on the profile symbolise the contour lines. You can add / remove a grid and features on the profile by selecting the adequate buttons on the right.
The following optional link opens an internet SVG tool for creating profiles from contour lines: http://contourmapcreator.urgr8.ch/
Remark: You can optionally reach some further information about contour lines in the following PDF documentation: contour_lines.pdf (7 Kb)
Elevation point
In addition to contour lines, heights of many points occur on the map, such as road intersections, summits of hills, lake shorelines, etc. These points are called Spot Heights. More precisely located and more accurate in elevation, the Trigonometric Points are marked by a plate fixed permanently on the ground. On a 1:25 000 Swisstopo topographic map, those Elevation Points are represented by the following symbols:
Shading
Shading is a method for representing relief on maps in a natural, aesthetic, and intuitive manner.
The light direction is the most important element for shaded relief. Normally, as shown in the following graphics, the light
illuminates the terrain from the upper-left. However, less popular is illumination from the south, as the relief shading tends
to look more correct. In extreme cases, relief inversion occurs where mountains appear as valleys and vice versa. Some local
adaptations are also possible.
 Shading on topographic maps
You can have a look (optional) on the relief shading website, to learn all rules existing for shading: colours, landforms, aerial perspectives, small scales, generalisation, etc.
Roll over the previous map with your mouse to get the same map with relief shading! Click on it to enlarge!
Remark: At a distance of 1-2meters, topographic map shading is most effective to be recognised for human eyes. Remark: The shading layer is still the base layer for a topographic map.
Rocks and cliffs representation
The representation of cliffs and rocks on topographic maps is a very difficult task still yet, even in the realm of digital cartography: the painting of rock hachures is mostly “hand-made”. Furthermore, this expensive method can only be produced by specialists: the painter has to use graphical tricks to give steep rocks depicted on a map equivalent visual importance compared to that observed in nature. During the last two centuries, cartographers have developed different cliff representation styles. On the following slide show, some of those methods are presented.
Relief versus Contour Lines
The two following pictures and animations are good examples to visualise the relation between relief (here represented using a Digital Elevation Model) and contour lines.
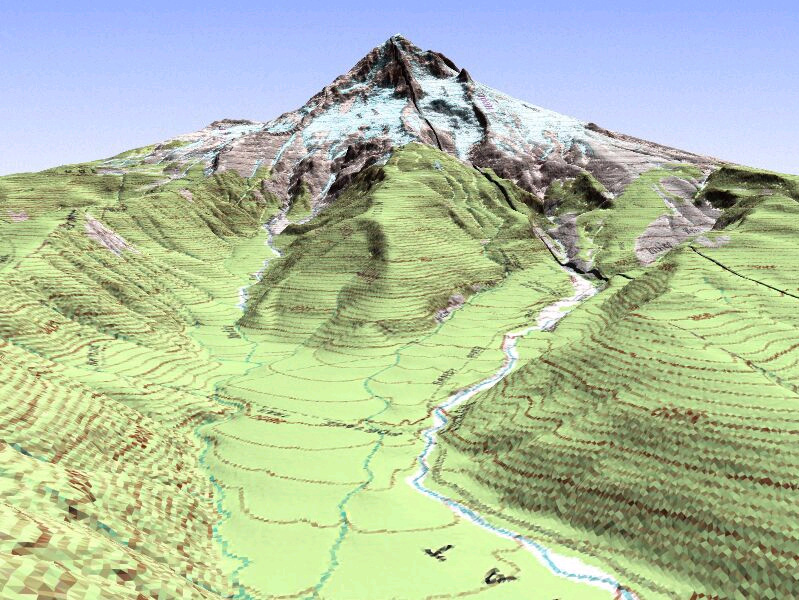 |
Picture of Old Maid Flat and Lost Creek (Mt-Hood) Digital Elevation Model, overlaid with a raster file of the topographic
Map. Created with World Construction Set 4 by M. Dobler (IKA).
|
USGS Geographic Data Download (external link).
|
Panorama from Timberline Lodge (Mt-Hood) Digital Elevation Model
overlayed with the topographic Map. Created with World Construction Set 4 by M.
Dobler (IKA). Press left mouse button in the image and move the mouse in a
direction you want.
|
USGS Geographic Data Download (external link).
Find the correct profile
In the following exercise, you have to find out which topographic isolines representation matches which profile. Drag the isolines on the bottom to the white rectangle corresponding to the correct profile. After you decided the five isolines representations, you can check your evaluation by clicking the button “Check Answers” which will appear. Try to be precise when dropping your isolines!
|
|
|
|