Indices of structure at the level of the whole study area
By extension, all the definite geometrical
indices for the level category/class in Table 3.1 can be applied
to the whole of the objects of the study area. It is thus superfluous
to again define them. It is on the other hand possible at this level
to produce thematic indices of structure returning account either of
the central tendency, or of the variability of the thematic properties
in the whole of the study area. Among many proposed we will retain
seven of them, including three of central tendency:
|
| Index of majority,
mode (MOD), nominal level: |
|
|
| vfmax: value whose surface is in a
majority in the whole of the area
|
Interpretation: It is the thematic value (category) most present in the area.
In object mode, it is the category whose surface is in a majority,
in mode image it is that of which the number of cells is largest.
|
|
|
| Median index (MED), ordinal level: |
|
|
| vmed:value of the central rank for the whole
of the units of observation in the area
|
Interpretation: It is the thematic value of the unit of observation (UO)
positioned in the middle of the ordered sequence of the values in the area.
In object mode the units of observation are ordered according to of their property value,
the median value is that of the object positioned in the middle of this sequence.
It is noted that the respective surface of the objects does not contribute,
but rather the number of feature relating to each property (importance of fragmentation).
In image mode, as the Units of observation have the same surface,
the median index considers the surface assigned to each property.
|
|
|
| Index of average (AVG), cardinal level: |
|
|
vi: thematic value of the unit of observation i
ai: surface of the unit of observation i
|
Interpretation: This index is in fact an average weighted by the relative surface of each UO.
In mode image, it is necessary to combine two layers (numerical grids),
one identifying the areas (spatial objects)
and the other describing the thematic property in each area.
|
|
|
| Shannon’s Index of diversity (SHDI): |
|
|
Pi: proportion of the surface of the study area occupied by category/class i
ln: natural logarithm
|
Interpretation: Index SHDI is equal to 0 when the study area is made up
of only one type of category or class (thematic homogeneity).
Its value increases according to the number of values (richness, diversity)
as well as to the uniformity tendency of the surfaces of each type.
|
An alternative of this index is proposed by the
Simpson’s index of diversity:
SIDI = Σ(Pi2).
The interest of this index is that its value varies between 0 and 1.
As for the index of Shannon, it is equal to 0 when the thematic diversity is null.
Its value tends towards 1 when the thematic diversity increases and
that the surfaces of each type of category or class tend to the uniformity.
|
|
|
| Index of richness (PR): |
|
|
| c: number of categories or classes (types) in the study area
|
Interpretation: It is a simple indication of diversity expressing
the thematic richness in the study area.
|
|
|
| Index of density of richness (PRD): |
|
|
c: number of categories or classes (types) in the study area
A: surface (m2) of the study area
|
Interpretation: This index expresses the density of richness per unit of 100 hectares.
It is thus possible to compare the richness of study areas of different surfaces.
|
|
|
| Shannon’s index of regularity (SHEI): |
|
|
Pi:proportion of the surface of the study area occupied by category/class i
c: number of categories or classes (types) in the study area
ln: natural logarithm
|
Interpretation: SHEI Index value varies between 0 and 1.
Its value is equal to 0 when the study area is made up of only one type of category or class (thematic homogeneity).
Its value approaches 0 when the surfaces of each type of category or class are very different (irregularity, predominance
of a type).
The index is equal to 1 when the surfaces of each type are perfectly equal (regularity).
|
|
|
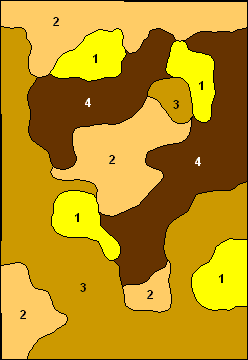
| Distribution of the
thematic classes in the study area |
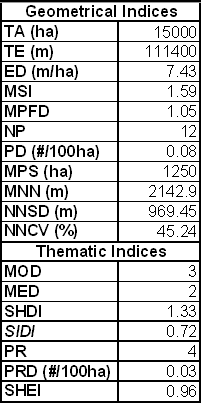
Value of indices of
structure at the level of the whole study area |
|
|
|
|
Exercises on Figure 3.4 and Table 3.4:
- Geometrical indices:
- In the table of geometrical indices distinguish the most suited:
- for the description of a study area?
- for the comparison of the characteristics of several study areas?
- Thematic indices:
- Based on the observation of the map, which seems to be the modal class?
Is this confirmed by the value of the thematic modal index?
- Reconstitute the ordered sequence of values to determine the median value.
Why this value is different from the modal value?
- How could one characterize in a few words the spatial arrangement
of the properties of soil aptitude in the study area?
Select the most relevant thematic indices among: SHDI, SIDI, PR, PRD, SHEI.


