Indices of texture of first order
1.3.10a Indices of texture of first order
These indices of
texture are based on the dispersion of the properties in the neighborhood,
they are thus dependent on the level of measurement of information.
The following indices will be retained:
|
| Diversity (DIV),
nominal level: |
|
|
| c: number of different values present in the neighborhood
|
Interpretation: It is a simple indication of diversity
expressing the thematic richness in the neighborhood.
It equivalent to the index of heterogeneity (NDC) previously described.
|
|
|
| Interquartile (IQ), ordinal level: |
|
|
Q1: first quartile
Q3: third quartile
|
Interpretation: It expresses the number of different values ranging
between the first and the third quartile (the difference of rank),
therefore the dispersion around the median value.
|
It is noted that only at the ordinal level the index of dispersion IQ
comes to supplement the pallet of the contextual indices previously
presented.
|
|
1.3.10b Exploitation of the contextual indices
In order to
illustrate the potential and the complementarity, but also the redundancy of
contextual indices presented in this Unit, let us apply to the description of
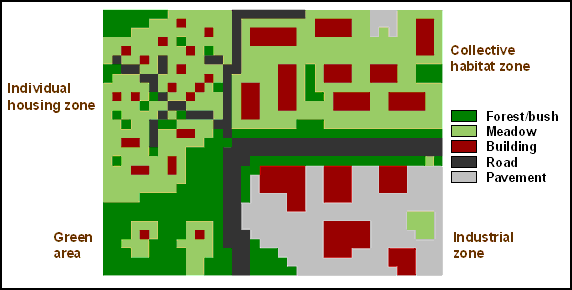
the spatial arrangement of land cover types in an urban area. Figure 3.6
presents the spatial distribution of 5 categories of land cover
(Forest/bush, Meadow, Building, Road, Pavement) in an urban area made up
of 4 distinct zones: individual housing, collective habitat,
industrial park and green area. The size of the cells is of approximately
15m on side. These thematic properties being categories,
they correspond to a nominal level of measurement.
|
Urban area made up of 5 different zones
|
|
|
The description of the spatial arrangement of thematic properties
of these units of observation (cells) can begin with the identification of the
most represented land cover category in the neighborhood. We will thus choose
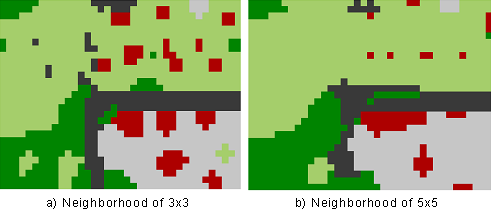
to retain the modal value in the moving window. In order to experiment the effect
of the neighborhood size on this index of majority
(central tendency), we will choose a window size of 3x3 as well as 5x5.
|
Modal property of the neighborhood in windows of size 3x3 and 5x5
|
|
|
One can observe on figure 3.7 the prevalence of the meadow category
for the 2 zones of habitat, of the forest/bush type for the green area and of
the pavement category for the industrial park. When a window of larger size (5x5)
is applied, then the spatial smoothing is more marked, thus reducing the presence
of vaster regions (objects) such as the buildings of big size in the industrial
park and in the collective habitat.
|
Indices of texture for windows of size 3x3 and 5x5
|
|
|
Exercises
-
- Which is the influence of the values assigned with the properties
on the value of each produced index?
- what can one conclude from it?
 Figure 3.6
 Figure 3.7
  Figure 3.8

