|
|
![]()
Spatial pattern and neighborhood of Point Features
Here we will learn about spatial patterns and neighbourhoods of point features. Especially, how to measure the distance between point features, how to create a buffer polygon or polygons from a point feature and how to create proximal polygons from the point features.
The linear distances (Euclidean distances) among the point features are fundamental properties to describe the spatial patterns of point features.
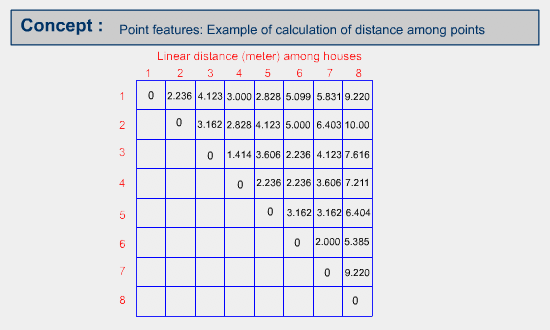
Example of distance calculation
The following is the result of calculating distances among point features or houses. The distance between a point and itself is 0.
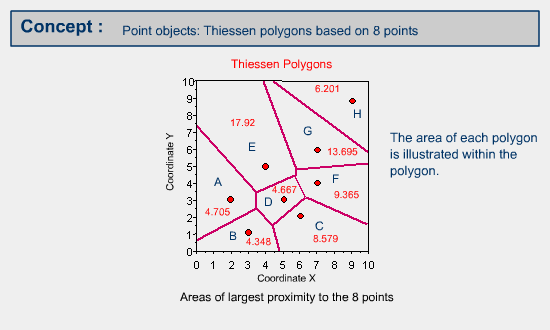
Example calculation of Thiessen Polygon
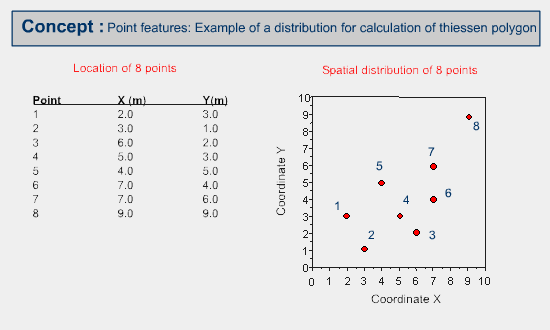
First, all points are triangulated into a Triangular Irregular Network (TIN) that meets the Delaunay criterion. Then, the perpendicular bisectors of each triangle edge are generated, forming the edges of the Thiessen polygons. The locations at which the bisectors intersect determine the locations of the Thiessen polygon vertices.
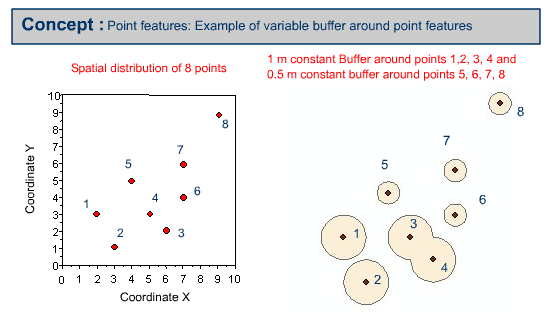
Example of buffering point features
Buffer polygon or polygons can be created by using a constant buffer distance or variable buffer distance around the specified input point feature.
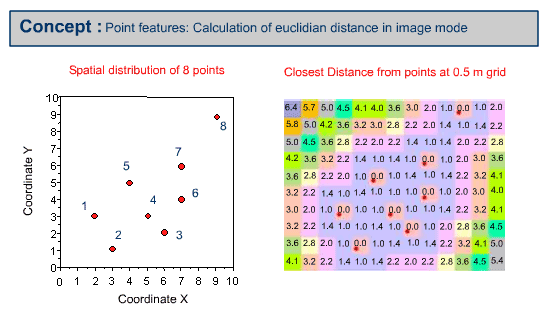
Example of calculating closest distance
Closest distances can be calculated from the point features using Euclidian distance. The following example is calculated based on the on the point distribution map illustrated to the 0.5 m raster grid.
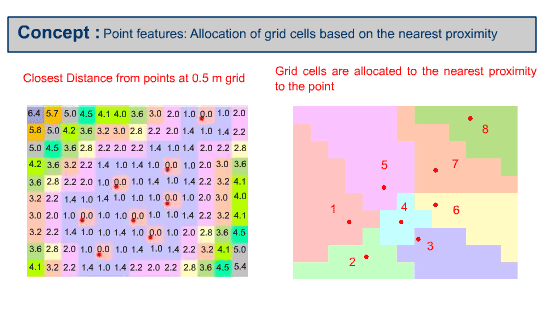
Then raster grid cells are allocated to the properties of point features based on the nearest proximity from the point feature (Thiessen's region).
Calculate the distance in object mode
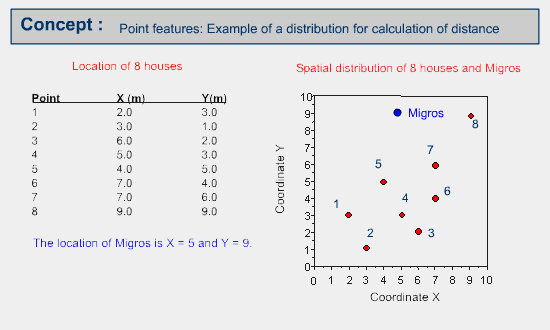
- Calculate the distance among point features, using the available GIS software from your GIS Lab, based on the point distribution map illustrated.
- Calculate the linear distance between Migros and individual houses, using the available GIS software from your GIS Lab. The result should be similar to the following.
| From Migros | To house | Distance |
|---|---|---|
| Migros | 1 | 6.708 |
| Migros | 2 | 8.246 |
| Migros | 3 | 7.071 |
| Migros | 4 | 6.000 |
| Migros | 5 | 4.123 |
| Migros | 6 | 5.385 |
| Migros | 7 | 3.606 |
| Migros | 8 | 4.000 |
Generate the Thiessen Polygons
Generate the Thiessen Polygons, using the available GIS software from your GIS Lab based on the point distribution map illustrated. The output area values should be similar to the values mentioned in the example illustration.
Calculate the closest distance in image mode
- Calculate the closest distance, using the available GIS software from your GIS Lab, based on the point distribution map illustrated. You may choose the resolution of the grid cell.
- Then allocate the grid cells to the property of the point feature based on proximity, using the available GIS software from your GIS Lab.
|
|
|
|