|
|
What Dynamic Mapping is
Dynamic mapping
Dynamic mapping can be considered as digital pro-active mapping, which is sufficiently well integrated to be presented via a single interface, or manipulated by a single program. The purpose for exploring spatial data via dynamic mapping is to reveal unknowns and is typically accomplished via a high degree of human interaction; animation is frequently an important component of data exploration. However, standalone spatial data exploration is also possible.
Interactive Mapping
Interactive Mapping is a special form of digital mapping, where the map changes according to the user inputs (interaction object). This is why the interactive map is characterised by an intuitive user interface consisting of graphical icons, pointing devices, and the near instantaneous display of maps. It includes “tools” to further zoom in on the map or open different areas. The types of interaction with a map can be categorised as graphic attribute-based:
- Interacting with a graphic could involve travelling through a map display, or make the map larger.
- Attribute-based interactions involve the manipulation of the map features through a separate database. For example, the display of a particular street by clicking on the street name.
Types of map interaction:
- Change in scale: zoom-in or zoom-out display,
- Change in symbolisation: size, colour of a symbol.
- Change in perspective: oblique view, etc.
- Etc.
Example of SVG based map interaction
Find below an example of SVG based map interaction. Click on the map to get the interactive map and explore the various interactions with your mouse.
Animated Mapping:
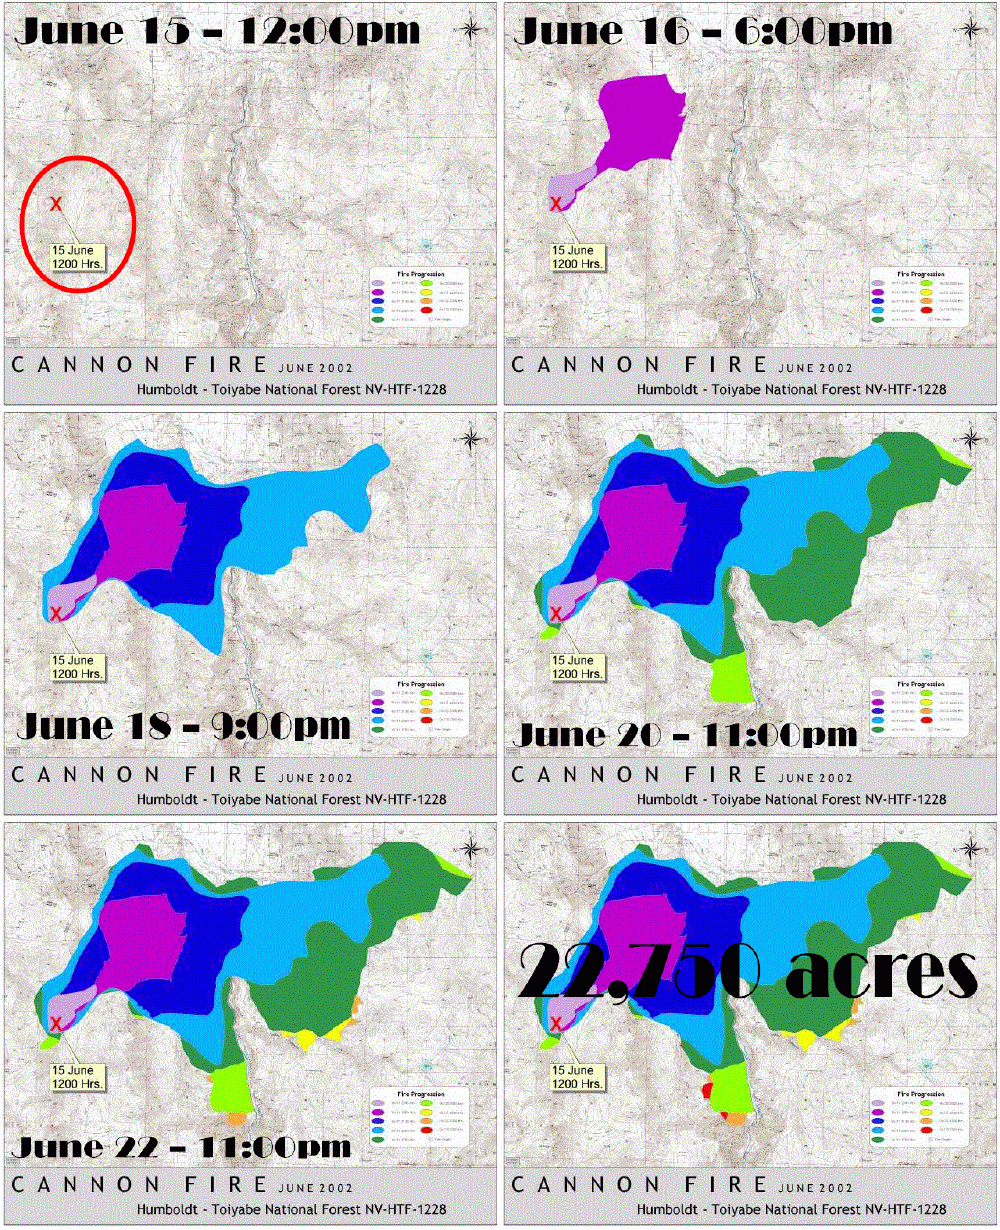
Animation is a “graphic art that occurs in time”. It is a dynamic visual statement that evolves through movement or change in display. The most important aspect of animation is that it depicts something that would not be evident if the frame were viewed individually and this without any user inputs after the departure of the animation. A basic distinction can be made between temporal and non-temporal cartographic animation:
- Temporal animations are limited to the display of change over time.
- Non-temporal animations include all other forms of animation in cartography.
The animation variables include both graphical manipulations and sound (sound can be used to accentuate an animation). The graphical variables of animation could include size, shape, position, speed, viewpoint, distance, scene, texture, pattern, shading, colour, etc.

