|
|
Change vector analysis method (CVA)
The principle of ![]() change vector analysis method (CVA) is to describe the change of individual
feature across the different phenomena (variables) between two limits of time
(two dates) as a vector within the variables space. Basically a vector can be
described with a magnitude and a
direction component. The magnitude
component expresses the amount of change as the direction component informs
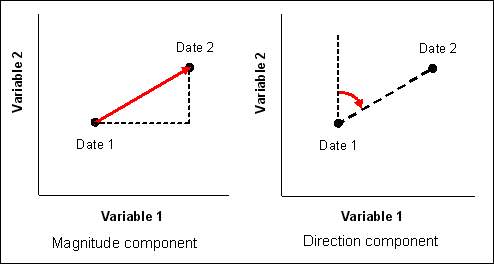
about the type of change. The next figure illustrates the principle of change vector
description within a two-dimensional variables space.
change vector analysis method (CVA) is to describe the change of individual
feature across the different phenomena (variables) between two limits of time
(two dates) as a vector within the variables space. Basically a vector can be
described with a magnitude and a
direction component. The magnitude
component expresses the amount of change as the direction component informs
about the type of change. The next figure illustrates the principle of change vector
description within a two-dimensional variables space.
 The two change vector components magnitude and direction describing the change of a feature between two time limits. Illustration
for a two-dimensional variables space (adapted from Eastman, 2008, p.104).
The two change vector components magnitude and direction describing the change of a feature between two time limits. Illustration
for a two-dimensional variables space (adapted from Eastman, 2008, p.104).Bivariate situation:
The analysis of time change in a bivariate situation corresponds to graphics in the last figure. This can be applied to simultaneously describe the change of properties of numerous features between two dates for two phenomena. A graphical representation as a scattergramme allows a comparison of changes between features to investigate. Change comparison is then based on three different characteristics:
- The location of the vector in this two dimensional space. It indicates the property values of each feature for the two variables and dates.
- The magnitude component expresses the amplitude of combined thematic change during the considered period of time. It indicates the individual dynamics of features.
- The direction component informs about the type of combined change between the two dates. It is measured as an angle clockwise from one variable axis, the variable 2 in the last figure.
Features can then be grouped into classes or categories of change
behaviour according to their magnitude and
direction values.
Multivariate situation:
When change analysis is concerned with more than two variables at a time,
two strategies are available for using CVA method:
The number of original variables can be reduced to two components through
a principal component transformation.
This allows to return to a bivariate situation for the change vector
analysis performed on these two first components. This approach is relevant
when original variables are sufficiently correlated for producing a high
degree of explained variations within the two first principal components.
Otherwise this transformation leads to a significant loss of thematic
information when undertaking the change vector analysis.
The bivariate change vector method can be extended to a multivariate
situation. One can imagine a variable space with not only two dimensions,
but n dimensions. The multivariate
change behaviour of each feature can still be described as a vector with a
single magnitude index, but with several direction indices, in fact
n-1. The magnitude component can
still be interpreted as the individual dynamics of features and direction
components still express in a more complex manner the type of multivariate
change occurring during this period of time.
