![]()
The Join count statistic (at a nominal level)
At the nominal level, only the presence or the absence of a specific thematic property is considered. This characteristic can seem restricting and simplifying, but it makes it possible to process phenomena which are originally measured on an ordinal level or even cardinal level. The specific property which one wants to characterise the distribution and the spatial dependency can thus express:
- at the nominal level, a particular category or a set of categories, for example the presence of a socio-economic category or a type of plant association.
- at the ordinal level, a class (a rank) or a set of classes, for example the presence of the best agricultural soil classes.
- at the cardinal level, an interval of values, for example the presence of a significant rate of criminality.
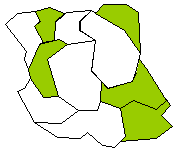
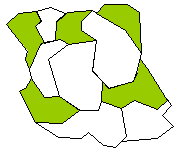
The thematic property to be described is thus reduced to a variable of binomial level (a binary variable) containing only two values referring to the properties of presence/absence (e.g. yes/no, white/black, 0/1). The description of the spatial dependency is expressed through the similarity to one of the three possible types of distribution: grouped, random or dispersed. Figure 2.4 illustrates these three types of spatial distribution for the same study area whose 5 zones out of the 11 are concerned with the presence of a particular property.
Three types of spatial distribution of binary properties. Presence in 5 zones and absence in 6 zones
|
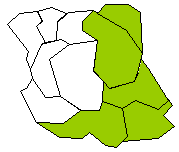
If the Binomial law or Poisson distribution enables us to determine the probability of an occurrence in the 11 zones of this area, it does not bring a response to the way in which these properties are spatially distributed. The join count statistic makes it possible to characterise the nature of this distribution according to three reference distribution: grouped, random or dispersed, and in consequence to deduce the force (degree) and the direction (positive or negative) of the spatial dependency. Thus, for the type:
- "grouped"; the spatial dependency is strong positively because the contiguity of zones with the property "occurring" is significant and consequently important too for zones of "absence".
- "random"; the spatial dependency is weak or even null because there is no similarity between the property of a zone and that of its neighbours.
- "dispersed"; the spatial dependency is strongly negative because the adjacency of the zones where the property occurs with that of the zones where if is absent is significant.
The join count statistic relates the number of observed connections between the zones of property "presence" and those of property "absence", with the theoretical number of connections of a random distribution. The definition of the theoretical number of connections of a random distribution is related to two factors:
- the spatial arrangement of features of the study area
- the choice of the null hypothesis
|
|
|
|