|
|
|
|
|
|
![]()
Area-class maps
Definition
Area-class maps depict phenomena or objects which are extensively distributed.
Imhof (1972, p. 115) distinguishes three types:
|
Truly areal areas e.g. rocks, waters, glaciated areas, forest areas and areas of arable lands, etc. |
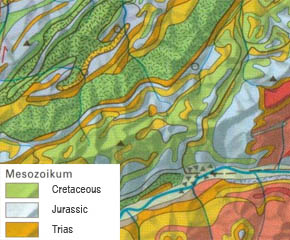 (Spiess 2004) (Spiess 2004) |
|
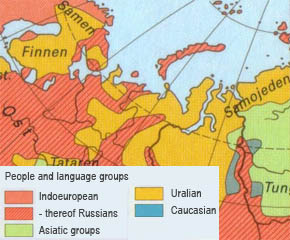
Fictitious areas e.g. areas with political or legal properties, areas of influence, etc. |
(Spiess 2004)
|
|
Areas as a form of generalisation of scattered and
isolated single objects e.g. limits of human occurrence, occurrence of animals, plants, diseases, etc. |
 (Spiess 2004) (Spiess 2004) |
Area patterns
Several graphical display elements can be used for the distinction of areas of different characteristics. The possibilities for variation depend on the chosen pattern type. The most common patterns are dot grids, scattered figures, line screens and fill colours.
The following table shows an overview of the possible display elements and their variation possibilities.
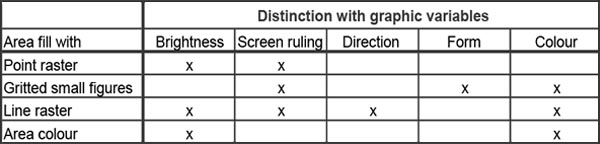
Conceptual differences of individual areas are mostly represented by varying their brightness. Thereby, darker colours indicate higher importance and lighter colours lower importance. If there are no differences in the importance, big differences in brightness should be avoided.
According to the form of the area patterns the items presented in the following interaction should be respected.
|
|
|
|