|
|
|
|
|
|
![]()
Isoline maps
Definition
The isoline representation is the most used method to visualise quantitative phenomena
which occur comprehensively and which values vary continuously in space. They are therefore called
continua. Examples for such continua are temperature, air
pressure, precipitation heights or ground elevations.
Isolines are lines which connect points with identical values
inside a continuum. Isolines are virtual and abstract. Gradients are related to isolines and show
the direction of the biggest value differences at a specific point. Gradients are always perpendicular
to isolines.
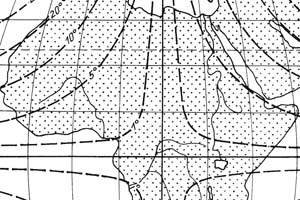
The map below shows an example of an isoline map.
 Source: (Spiess 2004)
Natural and geometrical continua
Imhof (1972, p. 127ff) distinguishes between natural and geometrical continua
Isolines of natural continua include in particular geophysical, geochemical and other continuous natural phenomena. In the fields of climate and meteorology isoline maps are often used. There are particular names for isolines of specific continua. Here are some examples:
|
Isotherme: lines of same temperatures |
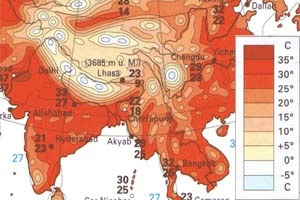 (Spiess 2004) (Spiess 2004) |
|
Isobar: lines of same air pressures |
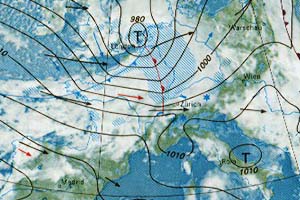 (Spiess 2004) (Spiess 2004) |
More examples can be found on the following link (German version only).
Isolines of geometrical continua do not exist naturally. They are calculated or constructed. Examples of geometrical continua are:
|
Isodistants: line of same distant to a reference line or a point |
 (Axhausen et al. 2005) (Axhausen et al. 2005) |
|
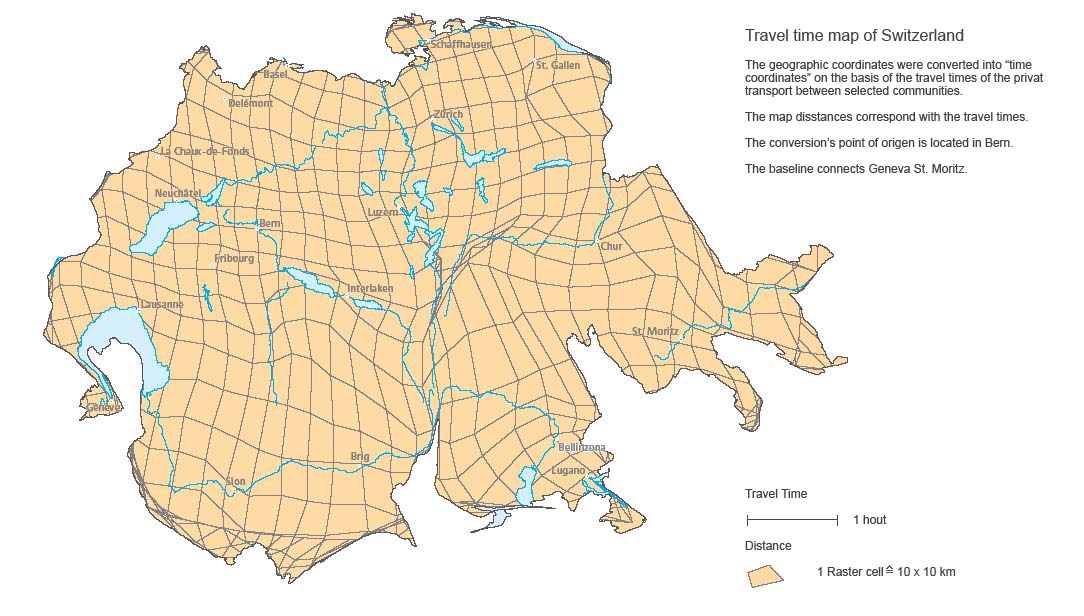
Isochrome: line of same temporal distant (time maps) |
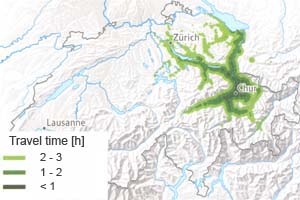 (Axhausen et al. 2005) (Axhausen et al. 2005) |
|
Distortion isograms: lines of same distortion |
 (Imhof 1972) (Imhof 1972) |
Design forms of isolines
Value gradations
For visualisations with isolines mostly equidistant
gradations are used. Depending on the topic or the data also other forms of gradations
are possible. For contour lines in areas like Switzerland, which include steep as well
as flat regions, a combination of two equidistant gradations are suitable.
Each of the following two pictures shows an extract of the
Swiss National map 1:25’000.
|
The left image shows a steep area in the Valais alps. To reach a good readability an equidistance of 20m is used. ") Landeskarte 1:25000, reproduced with permission from swisstopo (BA057224) Landeskarte 1:25000, reproduced with permission from swisstopo (BA057224) |
For the more flat area in the Swiss midland a smaller equidistance of 10m is more suitable. ") Landeskarte 1:25000, reproduced with permission from swisstopo (BA057224) Landeskarte 1:25000, reproduced with permission from swisstopo (BA057224) |
Besides this possibility also progressively increasing or random gradation can be used, whereby the second one is not recommended.
Fill colours
To increase the readability different levels of values can be summarised and coloured with a fill. The colours should be selected regarding the visualised topic. E.g. warm and cold regions could be coloured with reddish and blueish colours respectively (see isotherm map above).
Labelling
|
If there is an isoline map with different fill colours between the isolines there should be an explanation in the legend. |
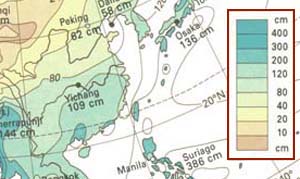 (Spiess 2004) (Spiess 2004) |
|
Isolines without fill colours are labelled directly in the map with their corresponding values. Depending on its length and geometry a isoline can by no means have multiple labels. This prevents the map reader from laborious search for the label. If there is not enough space to label each line, only main isolines can be labelled (e.g. only 100 or 1000). These main isoline should also be emphasized with a slightly greater line width. |
") Landeskarte 1:25000, reproduced with permission from swisstopo (BA057224) Landeskarte 1:25000, reproduced with permission from swisstopo (BA057224) |
|
|
|
|