Diagram maps (cartograms referring to a specific point or area)
Definition
In this section first the general aspects of diagram maps are described. Further on details of cartograms referring to a specific point and referring to a specific area are presented. Diagram maps or cartograms are cartographic forms of expression where values or properties are visualised in the form of diagrams on top of a simplified topographic map. The diagrams, which graphically refer to a certain point or area, are not aligned highly accurate but are correctly positioned. Absolute values as well as ratios or value intervals can be displayed. Relative values which correspond directly to the reference area should not be visualised with diagrams. For this purpose choroplethic maps are more suitable. The following figure shows a diagram map with cartogram referring to a specific area.
Characteristics of diagramm maps
Visual representation
As visual representations for diagram maps symbols and diagrams are used (Hake et al. 2002, p. 467). Depending on the topic and the dataset a continuous quantity display or a diagram representation is used.
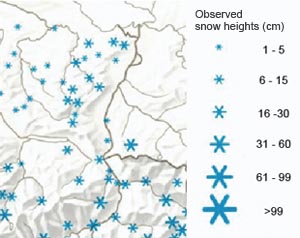 Local signatures with classified values (student work, IKA)
Legend
To make the map understandable for the map reader a legend with detailed explanations of the diagrams is essential. In the following figure an example of a diagram legend is shown. You can explore it interactively.
Object relation
Statistical data in diagram maps may have relations to particular points or locations like cities or areas. Therefore point related and area related diagrams are distinguished. The cartographic possibilities of these two map types differ in some cases. The following two chapters explain point related and area related diagram maps.
Map with point symbols
Properties
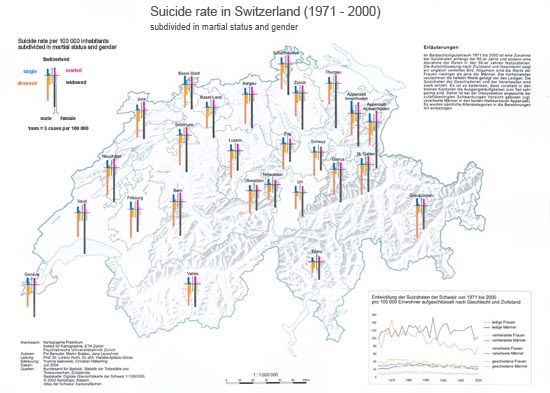
Point related diagram maps are always related to certain points. The diagram can be placed close or on top of the related point symbol. Most of the time it even replaces it. Though it is important that it is clear to which point the diagram is related to. For a better orientation the base map usually is rather detailed. The most important map elements are the point symbols as far as they are not overlayed by the diagrams. Furthermore the river network, the shaded relief and depending on the thematic content of the map, also the road and railroad network as well as administrative boundaries are relevant.
The following map is an example of a point related diagram map.
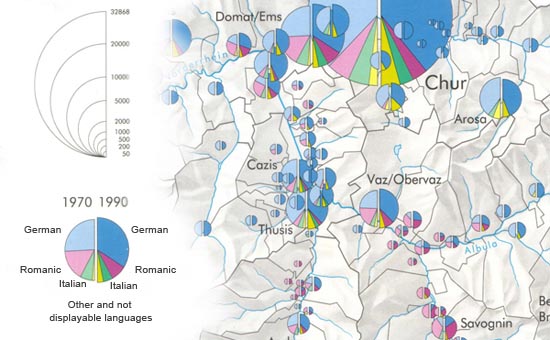 Point related diagram map (student work, IKA, ETH Zurich)
Diagrams
Due to the limited space in the map, the diagrams should be rather small, simple and easily adjustable to the center. Large and complex diagrams make the spatial allocation imprecise and favour interferences among the diagrams. Not all diagram types are appropriate for point related diagram maps. In the following interaction you can learn more about diagram types for point related diagram maps.
Map with area patterns
Properties
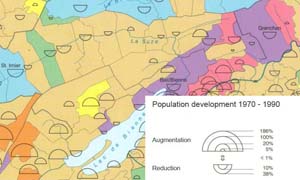
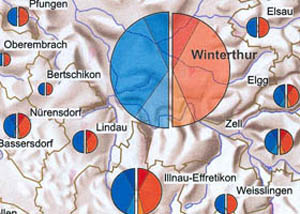
Statistical values are often related to well defined areas like districts or communities. Area related diagram maps are perfectly suitable for displaying such data. The diagrams are placed within the boundaries, in the centre of the related area or in the centre of gravity of the related urban area. As there is more space available in area related diagram maps the diagrams may be a bit bigger and more complex (Imhof 1972, p. 184), which offers the opportunity to include more information into the map. One has to consider that depending on the related areas there might also be small areas in which the diagrams also have to be placed. This is particularly the case within small scaled maps. The basemap for area related diagram maps can be simple. For the spatial orientation only the boundaries of the related areas as well as a simple river network are necessary.
Display of relative values
There is the possibility to also display relative values within area related diagram maps. In this case some rules have to be observed, to not communicate a false message. If one wants to display relative values which are not directly related to the area in which the diagram is placed there is the potential danger that the map reader interprets the size of the diagram as the size of the corresponding area. This can also be the case if in the legend the diagrams are explained explicitly. Figures of the related areas which are placed inside or around the diagrams can be a solution to that. This can be done in different ways as the following interaction shows.
Diagram size
The size of the diagrams in area related diagram maps play an important role within the map appearance and readability. If the diagrams are too small it is difficult to estimate the displayed values. If the diagrams are too big and even overlap the boundaries of the related areas, they overlay elements for orientation and make the map difficult to read. In the following visualisation the optimal size of the diagrams in the given map can be found interactively.
Cartographic conflict resolution in point and area related diagram maps
Diagram overlays
In diagram maps it often happens that diagrams overlay in dense areas or that one diagram is that big that it overlays all other diagrams and the basemap in a certain area. There are different methods to solve such problems. Basically big diagrams should be placed in the background, small diagrams in the foreground. This ensures that all diagrams are at least partly visible. To prevent the situation that one diagram gets too big and makes the map difficult to read one of the following tricks can be applied.
- all diagrams keep their size and position, but the bigger diagrams are visualised transparent. The base map will still be visible which is positive for the readability and the orientation. In addition the small diagrams get emphasized.
- for the bigger diagrams only the contours but not the fills are visualised. This is often used for simple pie- and rectangle diagrams which are not stacked.
- particular diagrams which overlay different others are placed outside of the map. An indicator should show their original position.
- very big diagrams are replaced by smaller ones which are still clearly bigger than the small ones. The values of these diagrams are noted directly in the map or in the legend. This method should only be used in exceptional cases.
- Diagrams with extreme values are split up in two or more separate diagrams. A unit diagram is to be defined. As many unit diagrams are then displayed as the original one can be split into. The remaining part will be shown in a corresponding smaller diagram. The unit diagrams can be stacked tightly which saves space on the map and makes it more readable.
The following interaction includes some examples in which the above
mentioned techniques are presented.
Generalisation of point and area related diagram maps
For the generalisation of point and area related diagram maps both the related areas and the diagrams have to be adjusted to the map scale. In the following interaction you will interactively become more familiar with the different types of generalisation of area and diagram maps.
Map examples
Below you can explore interactively four examples of point and area related diagram maps.

