|
|
|
|
|
|
![]()
Dot maps
Definition
Dot maps are used to visualise distributions and densities of a big number of discrete distributed single objects whereas, in contrast to location maps, not every single object is depicted but one symbol represents a constant number of objects. For this visualisation simple or pictorial point symbols can be used. Widely used are points which leads to the name of this map type. Population density maps are often dot maps.

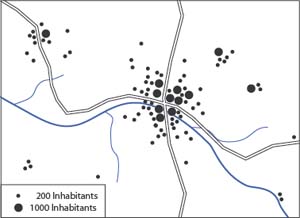
Quantitative symbols of fixed size
The most simple dot map uses a point symbol for a defined number of identical objects like in the previously shown image. The difficulty is to find an appropriate shape and size for the symbol as well as the value of it. The following interaction demonstrates how different a map can look like with different parameter settings.
Quantitative symbols of variable size
Quantitative symbols of variable size can be used if the map depicts an area where the object density is heterogeneous and where it is difficult to find and appropriate symbol of fixed size. Therefore different sizes of the symbol can be assigned to different values.
Maps with several thematic layers
Until now the shown examples of dot maps where all monothematic. But it could be different. It is also possible to combine different thematic layers which are related in some aspects. The differentiation of the objects is done by different shapes, sizes or colours of the symbols. It is important that the different layers do not compete with each other and the readability is still guaranteed.
The following example shows the distribution of seven different animal species.
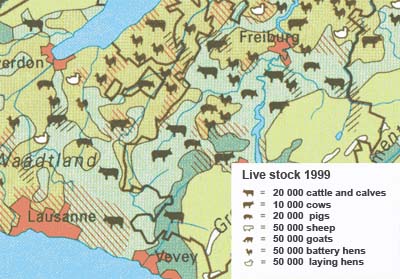 (Spiess 2004)
Advantages and disadvantages of dot maps
Advantages
- Dot maps are easy readable, also for laymen
- Are perfectly suitable to show density distributions
- By counting the symbols it is possible to determine the original data
Disadvantages
- The data have to be georeferenced with coordinates
- The map design is time-consuming and expensive
|
|
|
|